Grumman|Butkus Associates has released its 2023 Hospital Energy and Water Benchmarking Survey, featuring combined data from calendar years 2021 and 2022.
For the first time, the report charts and historical data are available at a dedicated website, including pull-down menus for sorting data by facility characteristics (for instance, hospitals with purchased steam or in-house laundry). These tools will make it easier for users to make comparisons between the survey data and patterns in their own facilities.
Users can also choose some aspects of data presentation (for instance, $/therm vs. $/MMBtu in the fossil fuel energy chart).
Every year since 1995, GBA has compiled data for its annual Hospital Energy and Water Benchmarking Survey. Hospitals are invited to participate by submitting responses to a brief list of questions regarding their usage of electricity, natural gas, oil, purchased steam, purchased chilled water, and domestic water/sewer.
GBA provides this benchmarking information free of charge to help the healthcare market evaluate facility performance.
The current report analyzes information provided by a total of 181 hospitals across two years — located in Illinois (80), Wisconsin (33), New Jersey (25), Nevada (16), Michigan (13), and several other states. Detailed data is presented for the following categories:
- Fossil Fuel Energy Consumption in Btu/sf/yr
- Fossil Fuel Energy Cost in $/sf/yr
- Average Fossil Fuel Energy Cost in $/therm
- Electric Energy Consumption in Btu/sf/yr
- Electric Energy Cost in $/sf/yr
- Average Electric Energy Cost in $/kWh
- Total Energy Consumption in Btu/sf/yr
- Total Energy Cost in $/sf/yr
- Water and Sewer Usage in Gallons/sf/yr
- Water and Sewer Cost in $/sf/yr
- Average Water and Sewer Cost in $/1,000 gallons
- Carbon Footprint in lb/sf/yr
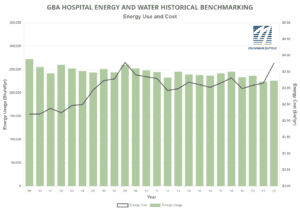
Hospitals have generally improved their efficiency since the inception of the GBA survey, helping to offset increasing utility rates. Total energy use (Btu/square foot) has declined since 2008, but energy costs ($/square foot) have fluctuated. In calendar year 2021, hospitals’ average energy costs were $3.16/sf; the number rose to $3.75/sf in CY2022. Most of this increase was attributable to increased prices rather than increased usage (chart, below).
Electricity costs have had the heaviest influence on rising energy costs over the past decade. In 2022, the average hospital spent almost three times as much on electricity ($2.78/square foot) as natural gas ($0.98/square foot).
Hospitals spent $0.46/sf on water/sewer in 2021 and $0.43/sf in 2022, compared with $0.27/sf in 2006, when GBA began collecting water/sewer data. In general, usage has trended downward since 2006.
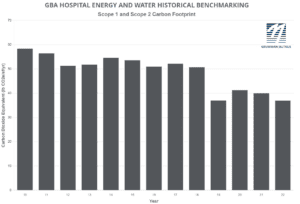
Scope 1 and Scope 2 carbon footprint in 2022 was the lowest it has been since GBA started reporting on carbon emissions in 2010, with output reductions mostly related to changes in the electric grid. Carbon footprint by facility varied widely, with most falling into the 30 to 50 pounds per square foot per year range.
The survey also collects information on energy and water cost per bed. The average cost for all utilities (excluding water) was $10,900 per bed for respondents from all states that included bed counts. For respondents that included water data, the average water/sewer cost per staffed bed was $1,550. As with carbon footprint, respondents’ energy costs per bed varied widely, from a high of more than $35,000 to a low of just under $4,400.
Visit the healthcare survey section of our website for access to detailed data and trends charts, as well as a link for submitting your CY2023 data. Survey participants will receive access to customized data that makes it easier to compare their facilities to others.
GBA has been helping hospitals develop and manage their energy management programs for more than 40 years. Contact us if we can help you in your efforts to become more energy efficient and resilient.


